The Silt Density Index (SDI) and the SDIcube™ - By Wes Byrne
The Silt Density Index (SDI) analysis can be the most accurate means of assessing the fouling rate of a reverse osmosis (RO) system or of a membrane filtration system.
It can be applied in qualifying water sources, estimating an RO cleaning frequency, or evaluating the performance of RO pretreatment equipment, but obtaining repeatable SDI results requires that the test be performed as discussed below.
Even with these methods, a manually performed SDI test will never achieve the accuracy, repeatability, and range of the SDIcube™ automation attachment.
The Silt Density Index (SDI)
The Silt Density Index test was developed in the early years of reverse osmosis as a means of onsite measuring the potential for RO fouling. It provided better correlation with the RO fouling rate than turbidity, particle size analysis (PSA), or a Total Suspended Solids (TSS) laboratory analysis.
The SDI's 0.45 micron filter removes most of the small biological polysaccharide particles, which like an RO membrane, cause a reduction in its water permeation. These biological fouling particles are under-represented in turbidity and PSA analyses because they are well hydrated and therefore do not refract light well. They are also under-represented in a TSS analysis, because the water that makes up the majority of these particles is evaporated off.
How to Obtain a Repeatable SDI Result
The standard SDI test procedures do not result in consistent SDI values that reflect the RO fouling potential. These procedures may address some, but not all of the following issues impacting SDI results:
- The water system sample port and the SDI test equipment must be flushed at high water velocities prior to testing, similar to the requirements for pulling a bacteria sample.
- Water temperature affects SDI results due to its effect on water permeation through the test filter.
- SDI filter water permeability and the effect of its fouling vary for filters from different manufacturers.
- The SDI time measurement must be started within seconds of opening the device inlet valve.
- The total SDI time must be limited to prevent the filter flow rate from declining by more than 50 percent.
Nearly all of the preceding issues are related to the SDI flow rate because the water flow directly affects the flow of fouling particles to the SDI filter. A reduced SDI flow rate means a reduced filter fouling rate and subsequently a lower SDI value.
Waiting too long to start timing the flow rate through the SDI filter is a common error. If more than a few seconds are required to set the pressure regulator to 30 psi, the SDI filter flow rate may already be reduced by particle fouling. This means that the SDI result will be lower than if correctly performed.
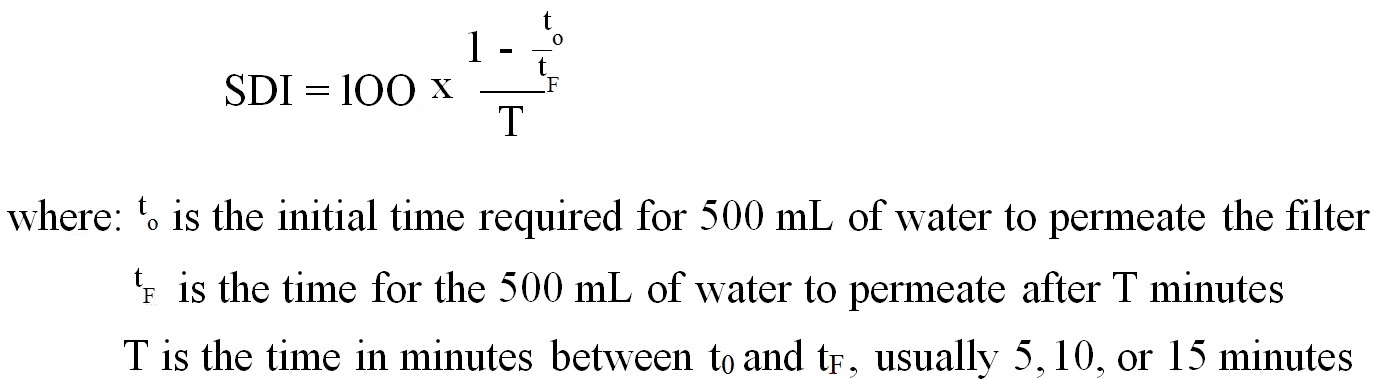
If the water temperature is 22 to 25 degrees C, the initial time for 500 mL to permeate the filter should be about 30 seconds. Significant variation from this value will impact the SDI result if it is not mathematically corrected.
The SDI test was developed before calculators were readily available, so it was based on total test times of 5, 10, or 15 minutes. If the SDI filter lost more than 75% of its permeability for a 15-minute test, then the test result would be based on a 10-minute test time, or possibly on a 5-minute test time if too much plugging occurred over 10 minutes.
The problem with these guidelines is they result in very different results when the test is limited to 5 or 10 minutes instead of 15 minutes. For example, a water source that tests out with an SDI of 5.8 with a 15-minute test will provide an SDI value of about 10.0 when performed over 5 minutes. This extreme inconsistency results in a high degree of result variability based simply on the chosen time of the test, and this variability is further amplified by the effect of the particular filtered solids on permeability over time.
The Effect of the Filtered Solids on the SDI Results
The permeation flux rate of an SDI test is about 6,000 times that of an operating RO membrane. As compressed by this high water flux rate, the effect of fouling solids on the SDI flow rate is far greater than what it would be on an RO permeate flow rate. Allowing the SDI filter to foul to the point of the fouling solids significantly impacting the SDI value means that this value will not correlate well with the RO fouling rate.
It has been found that limiting the SDI test time based on a maximum filter plugging of 50% will provide results that are more consistent. If the test time can be taken to the minute mark before exceeding this point of 50% plugging, rather than relying on only the 5, 10, or 15-minute increments, much better repeatability is obtained. Furthermore, the resulting SDI value better reflects an RO fouling rate and correlates with the number of required RO cleanings per year.
The SDIcube™
The SDIcube™ from Purewatercloud automatically and accurately measures the flow rate exiting the SDI test filter and determines the SDI at the minute mark just prior to the point of 50% filter plugging, if this occurs prior to 15 minutes. It normalizes for the effect of non-standard filter permeability, including if the filter has already been allowed to foul prior to initiating the test. It corrects for the effects of high or low water temperature. It can even provide repeatable SDI values with water sources that quickly foul the SDI filter, such as if the SDI is greater than 25.
The SDIcube™ saves time since once the test is initiated, it requires minimal supervision for the remainder of the test. The results can be read off its display at any time after the test completion. The SDIcube™ can even power an optional pump if needed for performing bucket testing or for boosting the pressure of a low pressure water source. The SDIcube™ will also switch operating modes to filter a liter of sample water for performing the Millipore Iron Test.